Real Property Report - California, January 2014

Market Activity
California single-family home and condominium sales fell 18.7 percent in January 2014 from December 2013, and were down 11.8 percent from a year ago. Taking a longer-term view, in the past 12 months (February 2013 through January 2014), sales are down 6.5 percent compared with the same 12-month period (February 2012 through January 2013) a year earlier.
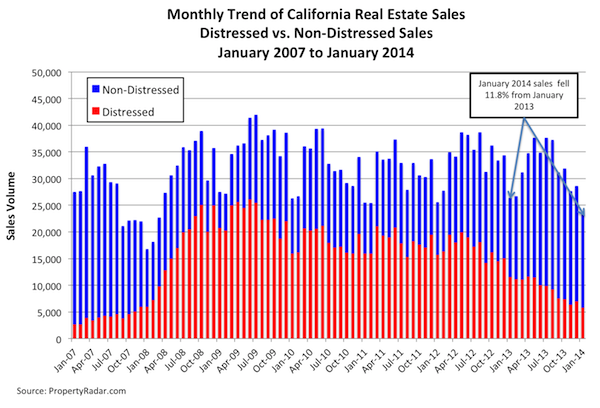
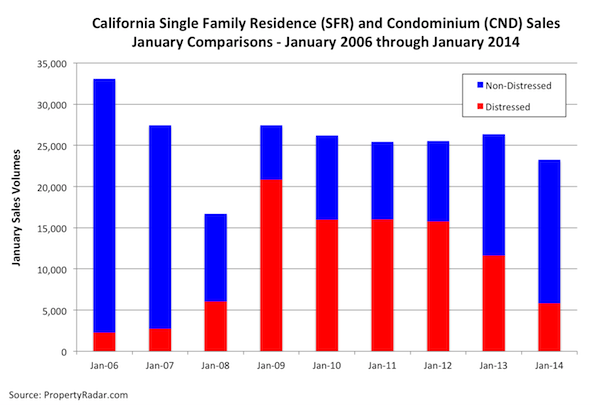
To get a clearer picture of current real estate sales trends and to eliminate seasonal factors, we compare January 2014 property sales with January sales in prior years and divide sales into their distressed and non-distressed components. Non-distressed sales fell 18.9 percent in January 2014 from December 2013 but gained 18.2 percent year-over-year. Meanwhile, distressed property sales declined 17.8 percent for the month and were down 49.9 percent for the year.
Despite January’s sizeable falloff in distressed property sales, they still accounted for 25.0 percent of sales, which remains historically high. More importantly, distressed property sales as a percent of total sales remain much higher in counties away from the coastal areas. Of the state’s 26 largest counties, the eight with the highest percentage of distressed property sales — Fresno, Kern, Merced, Sacramento, San Bernardino, San Joaquin, Stanislaus, and Tulare — are in non-coastal areas, where distressed property sales represented more than 30 percent of sales; Tulare County was highest at 39.2 percent.
The eight counties with the lowest percentage of distressed property sales — Alameda, Orange, San Diego, San Francisco, San Luis Obispo, Santa Clara, Sonoma, and Ventura — are in coastal areas, where distressed property sales represented less than 23 percent of sales; San Francisco and Orange county were lowest at 9.6 and 16.0 percent, respectively.
Median Prices
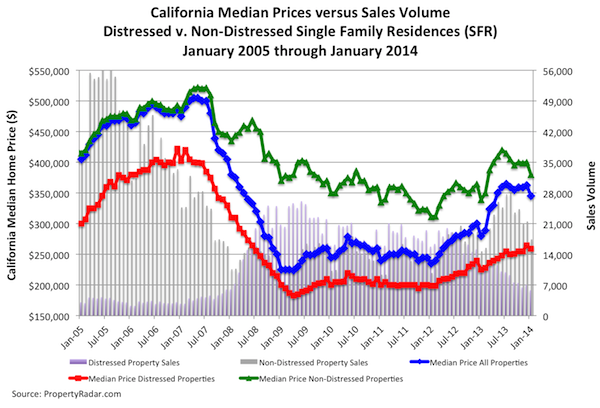
In January, the median sale price of a California home fell $17,500, or 4.8%, to $345,000 from $362,500 in December, the largest monthly decline since January 2013. That’s not surprising because seasonal factors often cause large declines in median sale prices in January. Median home prices rose rapidly in 2012 and the first half of 2013 before reaching a plateau in June 2013. From June through December 2013, median prices trended sideways, hovering around $360,000 as the market digested the sudden, 100-basis-point mortgage interest rate increase in May and June 2013. On a year-over-year basis, from January 2013 to January 2014, median prices increased 23.2 percent from $280,000 to $345,000.
Changes in the mix of distressed and non-distressed property sales from 2012 to 2013 continue to influence year-over-year changes in median prices. Distressed property sales decreased from 44.0 percent of total sales in January 2013 to 25.0 percent in January 2014. Meanwhile, non-distressed property sales increased from 56.0 percent to 75.0 percent of total sales. Over that time span, the median price of a distressed California home increased 15.1 percent year-over-year from $225,000 in January 2013 to $259,000 in January 2014. Meanwhile, the median price of a non-distressed home increased 12.1 percent year-over-year, from $339,000 to $380,000.
The following graph highlights median sales prices from January 2005 to January 2014. Aggregate single-family home median sales prices are shown in blue, and distressed and non-distressed median prices are shown in red and green, respectively.
Homeowner Equity
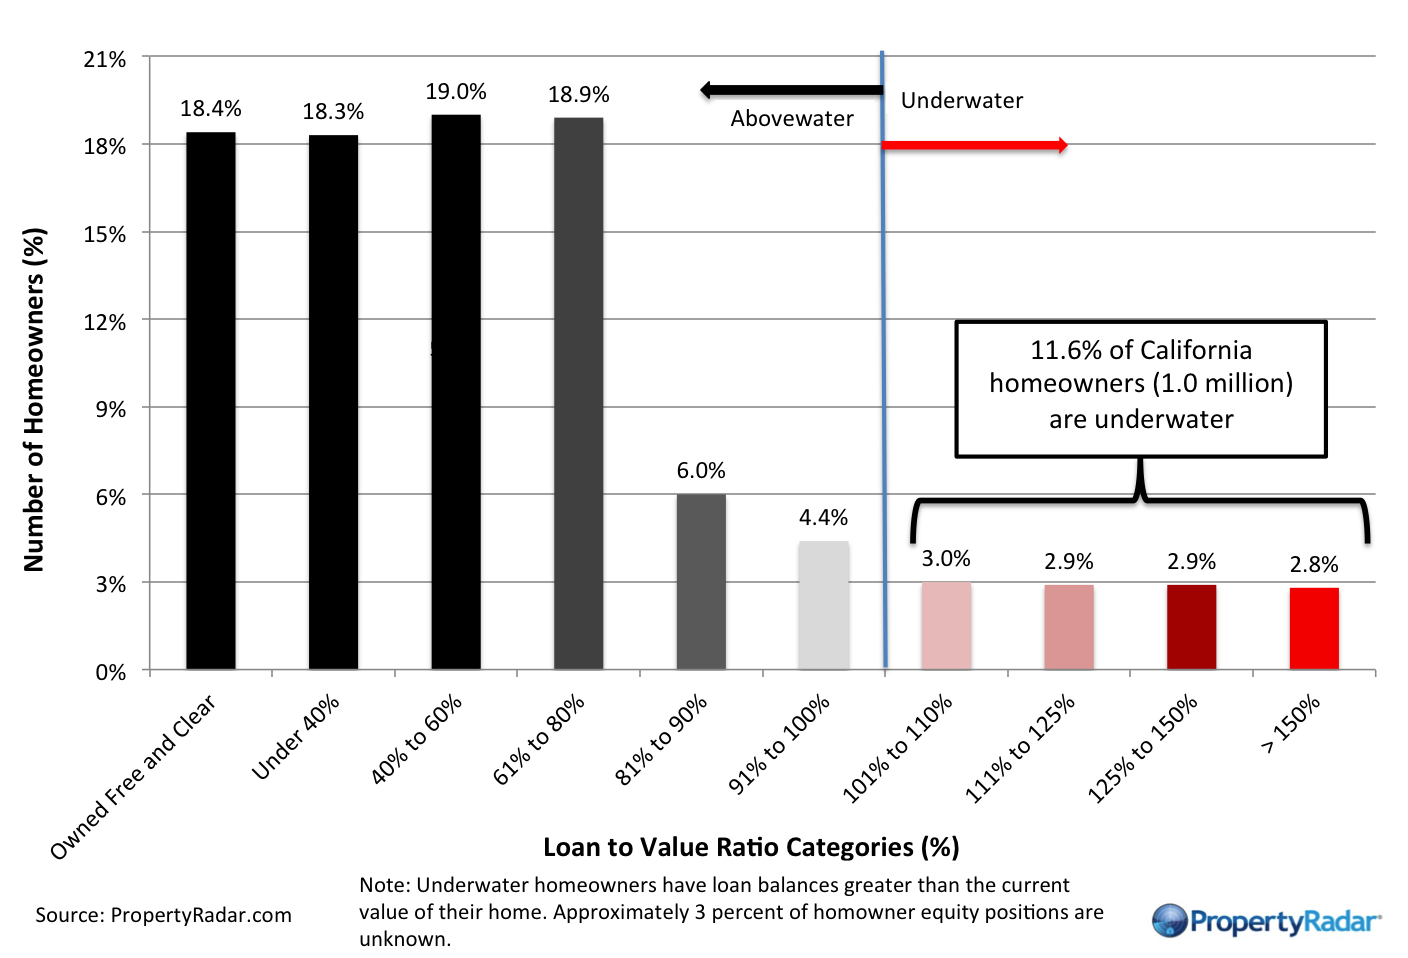
The steady rise in home prices since January 2012 has pushed thousands of previously underwater homeowners in California into positive-equity status so they can refinance or sell their homes. In January 2014, the number of homeowners with more than 10 percent equity in their homes increased 2.0 percent, or 100,000 homeowners; in the past five months that number has increased by 5.1 percent, or approximately 250,000. Since August, the number of moderately to severely underwater homeowners has fallen by 15.9 percent, or approximately 190,000.
Despite the improvement, large numbers of underwater homeowners remain a drag on the California real estate market. In January 2014, nearly 1.3 million (15 percent) of California’s 8.65 million homeowners were underwater while nearly 405,000 (4.7 percent) were barely above water (less than 10 percent equity in their homes). Since home-resale costs represent up to 10 percent of the sale price, these homeowners are effectively underwater. All told, 19.7 percent of homeowners (approximately 1.7 million) are underwater or barely above water — and effectively shut out of the California real estate market.
Several of California’s largest counties continue to struggle with much higher levels of negative equity. In Fresno, Kern, Merced, San Bernardino, San Joaquin, Solano, Stanislaus, and Tulare counties, 30 to 36 percent of homeowners are moderately to severely underwater.
Cash Sales
In January 2014, cash sales fell 11.1 percent from December 2013 and are down 21.2 percent in the past 12 months. The decline in cash sales mirrors the decline in total sales due to seasonal factors that typically depress sales this time of year. Despite the decline in sales volume, cash sales represented 26.1 percent of total sales, up 2.3 percentage points from 23.8 percent in December 2013. Taking a longer-term view, cash sales as a percent of total sales oscillated between 28 percent and 31 percent from January 2012 through January 2013.
They peaked at 33.0 percent in February 2013 and stayed below 25 percent from August through December. Despite recent declines, cash sales remain high from a historic perspective and are an important part of the real estate marketplace.
Flipping
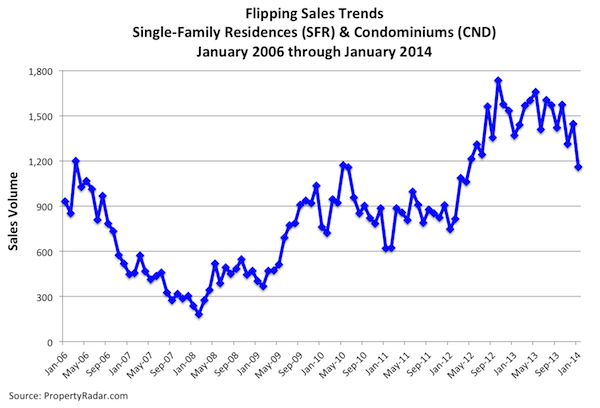
January 2014 flipping (reselling a property within six months) fell 19.8 percent in part due to seasonal factors that typically depress flipping this time of year. Flipping was down 15.3 percent from a year ago. Flips represented 5.2 percent of total sales in January 2014, up from 5.0 percent in December 2013.
Taking a longer-term view, in 2011, as housing prices trended sideways, flipping was basically flat, ranging from 2.5 percent of sales in January to 2.7 percent in December 2011. In 2012, flipping as a percent of sales began to increase, rising from 2.9 percent in January 2012 and peaking in February 2013 at 5.5 percent. Flipping retreated from February 2013 to June 2013, reaching an interim bottom of 4.1 percent of sales.
In January 2014, within the 26 largest California counties, flipping as a percent of sales was greatest in Contra Costa, Los Angeles, Orange, Sacramento, San Bernardino, San Diego, Santa Cruz, and Stanislaus counties; Orange and Stanislaus counties were the highest at 8.2 and 7.6 percent of sales, respectively.
Institutional Investor (LLC and LP) Activity
We approximate institutional investor activity by looking at purchases and sales made by limited liability corporations (LLC) and limited partnerships (LP). From our research, all activity by hedge funds, real estate investment trusts, and other entities that are pooling large sums of money to invest in residential real estate are doing so in one of these two business structures. While institutional investors represent the bulk of activity, there are some other entities, like relocation companies, that also use these business structures to buy and sell residential real estate. Their activity is included here as well.
Market Purchase Activity
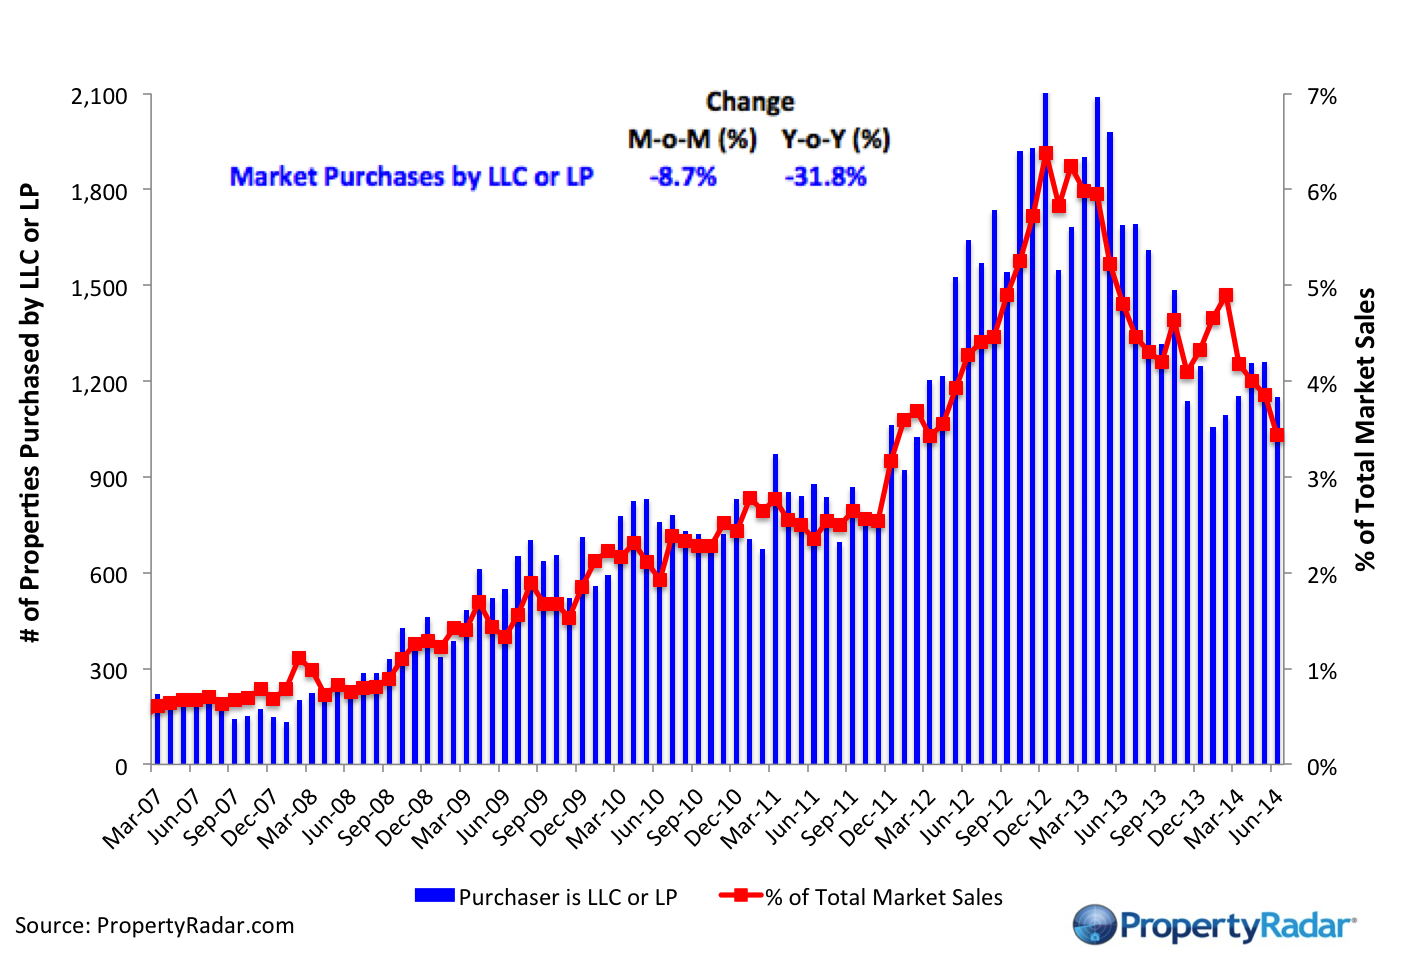
Market purchases by LLCs and LPs posted steady gains from 2008 through 2011, accelerating rapidly in 2012 and reaching a peak in December 2012. Since then, LLC and LP market purchases have been trending lower and are now 52.1 percent below their December 2012 peak. Despite the longer-term decline, January 2014 purchases represented 4.4 percent of total sales up from 4.0 percent in December 2013.
The steady decline in LLC and LP market purchases is being driven primarily by the increase in purchase prices. As prices rise, the potential return on investment (ROI) for holding properties as rentals decreases, making homes less attractive to buy and hold investors.
Trustee Sale Purchase Activity
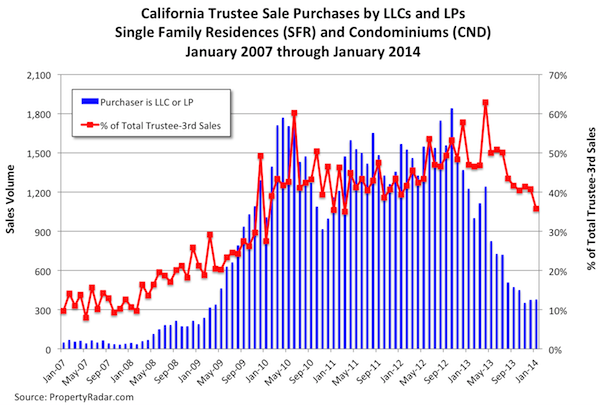
Purchases by institutional investors (LLCs or LPs) at the trustee sales (foreclosure sales) gained 0.8 percent for the month but are down 73.6 percent from a year ago.
The steady decline in LLC and LP trustee sale purchases are being driven by two factors; 1) the reduced number of trustee sales and 2) the reduction in return on investment (ROI) due to higher prices.
Market Sales Activity
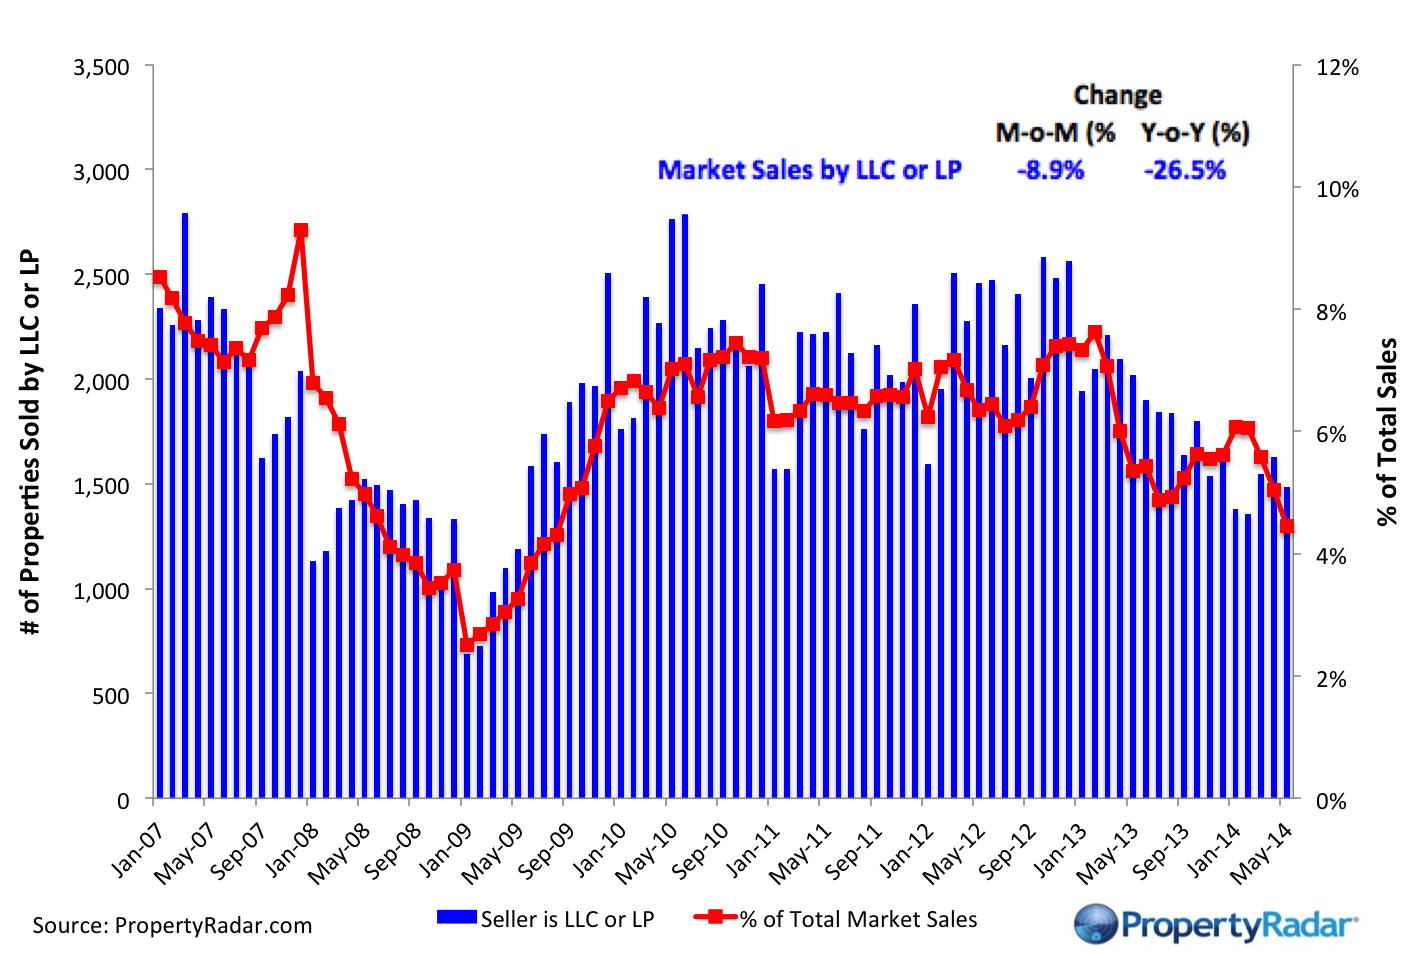
Market sales by LLCs and LPs represented 6.0 percent of total sales in January 2014, up from 5.6 percent in December 2013 and up from 4.8 percent of total sales in July 2013. Despite this increase, total sales by institutional investors has been declining and we see no evidence that the major buyers over the last four years have begun to significantly reduce their accumulated inventory.
Foreclosures
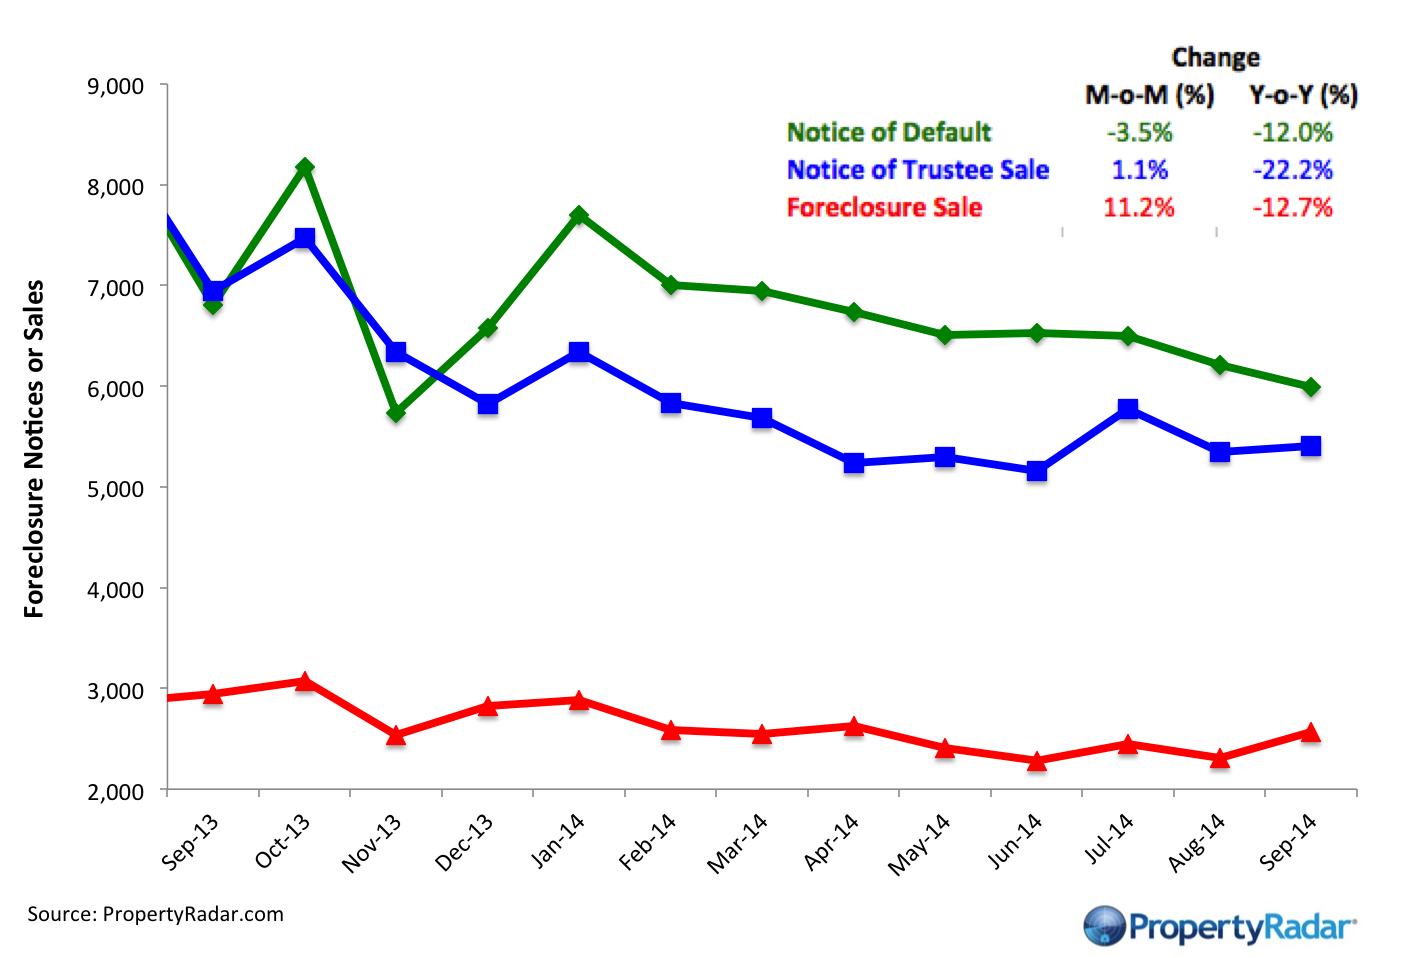
California Notices of Default and Notices of Trustee sale gained 12.9 and 6.0 percent, respectively in January 2014 over the prior month. Notices of Default, the first step in the foreclosure process, are up 52.9 percent from a year ago while Notices of Trustee Sale are down 35.7 percent for the year. Foreclosure sales gained 1.9 percent for the month but fell 48.1 percent for the year.
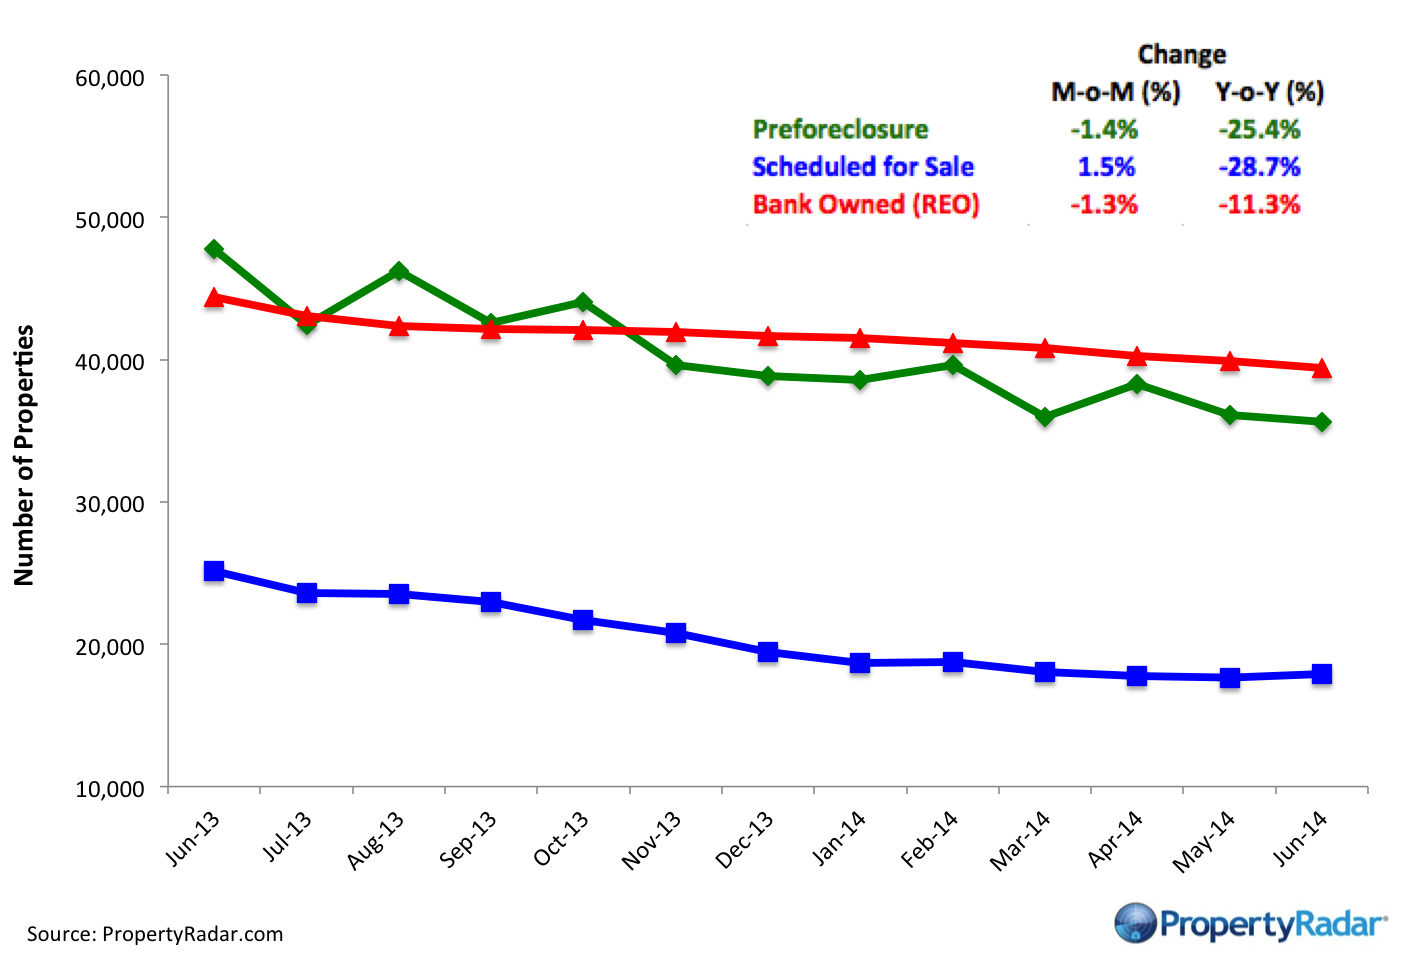
January 2014, foreclosure inventories — Preforeclosure, Scheduled for Trustee Sale, and Bank Owned (REO) — were at or near pre-housing crisis levels. Bank Owned (REO) inventory was nearly unchanged for the month and has trended mostly sideways since August 2013. Meanwhile, Preforeclosure inventory declined 1.5 percent, and Scheduled for Trustee Sale inventory fell 5.1 percent. In the past 12 months, Bank Owned (REO) inventory is down 27.2 percent, while Pre-foreclosure and Scheduled for Trustee Sale inventories fell 18.8 and 61.2 percent, respectively.
Madeline’s Take – Director of Economic Research, PropertyRadar
For the sixth-consecutive month, January 2014 California property sales declined year-over-year, suggesting that the May-June 2013 jump in mortgage interest rates isn’t the only factor slowing California real estate sales. I believe two more temporary factors will likely push sales lower through Q2 2014:
- Lack of for-sale inventory — For-sale inventory has improved since last year but is still not plentiful enough to encourage people to sell. Real estate agents have mentioned that homeowners who want to sell will not put their homes on the market unless there is something for them to buy. The complaint I hear over and over is that it’s slim pickings out there, leaving would-be home sellers on the sidelines waiting for more supply. Builders are responding to pent-up demand by building new homes, but new supply will probably not hit the market until later this year.
- Consumer Financial Protection Bureau’s (CFPB) Qualified Mortgage (QM) Rule will likely hamper sales in 2014 — I have been told the CFPB’s QM rule that went into effect in January is limiting the pipeline of available buyers. One agent grumbled to me that the average credit score of qualified buyers is well above 750, which effectively shuts out many would-be buyers. While it is too early to tell how much the QM rule will affect sales because the market needs more time to digest the new requirements, early reports point to lower sales in 2014.
Fortunately for the California real estate market, mortgage interest rates have edged lower since late last year due to emerging markets turmoil and a flight to the safety of the U.S. dollar and U.S. Treasuries. As demand for the 10-year Treasury note goes up, yields go down, which puts downward pressure on mortgage interest rates. Emerging markets turmoil is likely to be around for a while, giving the Federal Reserve cover to continue reducing its QE 3 bond purchases without too much risk of pushing up mortgage interest rates and punishing the housing market.
Sean’s Take – Founder/CEO, PropertyRadar
The recent slowing in market activity demands careful attention. The two prior major slow downs occurred in late 2005 and 2010. The decline in sales at the end of 2005 was our first clue that the housing bubble was about to burst. The decline at the end of 2010 was due to the ending of the first time homebuyer tax credit, which reduced demand. Today we sit in a very different situation from either of those events. In 2005 the market was clearly over-valued, with home prices far exceeding what homebuyers could afford to pay – at least without the help of a teaser-rate pay option ARM mortgage. Conversely in 2010, the market was clearly under-valued, with home affordability at bargain levels that had not been seen for years – which after a brief respite led to increases in both prices and activity. Today, I believe values are more reasonable and that we should expect neither the disaster the followed the 2005 activity decline, or the gains that followed the decline in late 2010.
Real Property Report Methodology
California real estate data presented by PropertyRadar, including analysis, charts and graphs, is based upon public county records and daily trustee sale (foreclosure auction) results. Items are reported as of the date the event occurred or was recorded with the California county. If a county has not reported complete data by the publication date, we may estimate the missing data, though only if the missing data is believed to be 10 percent or less of all reported data.


